

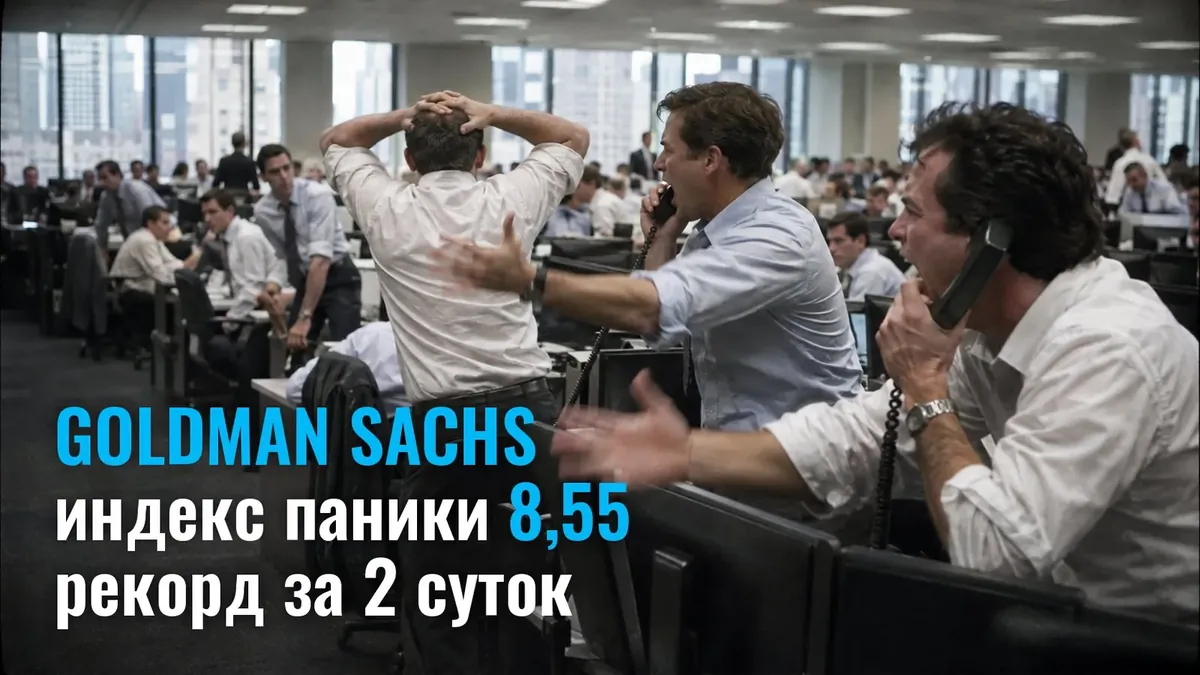
The Goldman Sachs Panic Index moved 8.55 points in two days on a scale of 0 to 10. That level has never been reached in the entire history of the calculations. The previous record was 7.87 points, set on April 16, 2013.
What this indicator is. An internal stress gauge used by Goldman Sachs' trading desk. It measures tension in the US equity market from zero to ten.
Why this matters to a trader. The US equity market went from a rally to its worst session since April 2025 in two days. And after previous readings above 9.5 points, the S&P 500 more often reversed upward.
How did the index move?
The peak came on Thursday. The indicator jumped about five points to 9.57 - the third-largest daily rise in history. Barchart provided the movement figures.
- 8.55 points - the index's move over two days, a record for the entire history of the calculations
- 3% - the Dow Jones gain on Wednesday, November 4
- 4.36% - the S&P 500 decline the next day, the worst session since April 2025
- 11.23 million put options - Cboe volume that day versus the previous high of 10.22 million contracts from April 4, 2025
Why did the indicator jump so much?
- Democratic victory. On Wednesday, November 4, US stocks rose after the Democrats won both chambers of Congress. The Dow Jones added 3%.
- Clients removed their hedges. During that rally, Goldman Sachs clients sold off their protective positions. The indicator posted the fourth-largest daily drop in history.
- AI chip selloff. The next day, a selloff in AI chipmaker stocks sent the S&P 500 down 4.36%. By then, there was no protection left in portfolios.
How the index is calculated. It is based on options market signals: implied volatility and the price of downside protection. A put option gives the right to sell an asset at a pre-agreed price.
What does this mean for a trader?
The 9.5-point threshold is rare. The index has crossed it only 15 times. After those instances, the S&P 500 gained an average of 4.6% over three months and about 9% over six months.
- 80% - the share of cases with gains over a three-month horizon
- 73% - the share of cases with gains over six months
Lee Coppersmith, a Goldman Sachs trader, in a comment to Bloomberg linked the selloff to poor positioning and a forced restructuring of hedges: "It's too early to jump into risk assets, but it's getting harder and harder to ignore the potential opportunity on the other side."
What's next?
Forced selling is still ongoing. While it continues, the historical scenario stretches out over time.
- Panic index - will it fall below 9.5 points
- S&P 500 - will it deliver the average 4.6% gain over three months
- Cboe put options - will volume hold near 11.23 million contracts
Upcoming US market events are collected in the economic calendar, and a breakdown of the rules for trading on someone else's account is in the academy.
Did you see that candle in the S&P 500?
Thursday took 4.36% off the index. The market doesn't produce days like that for months. On an account of a couple thousand dollars, it closes out at an amount you don't even notice. In prop trading, account size stops being your problem: a paid evaluation, then the firm's trading account with a hard loss limit and your profit share under contract. The 9.5 threshold on the panic index has been crossed 15 times, and there will be a sixteenth - it makes sense to understand the mechanics before it happens.