

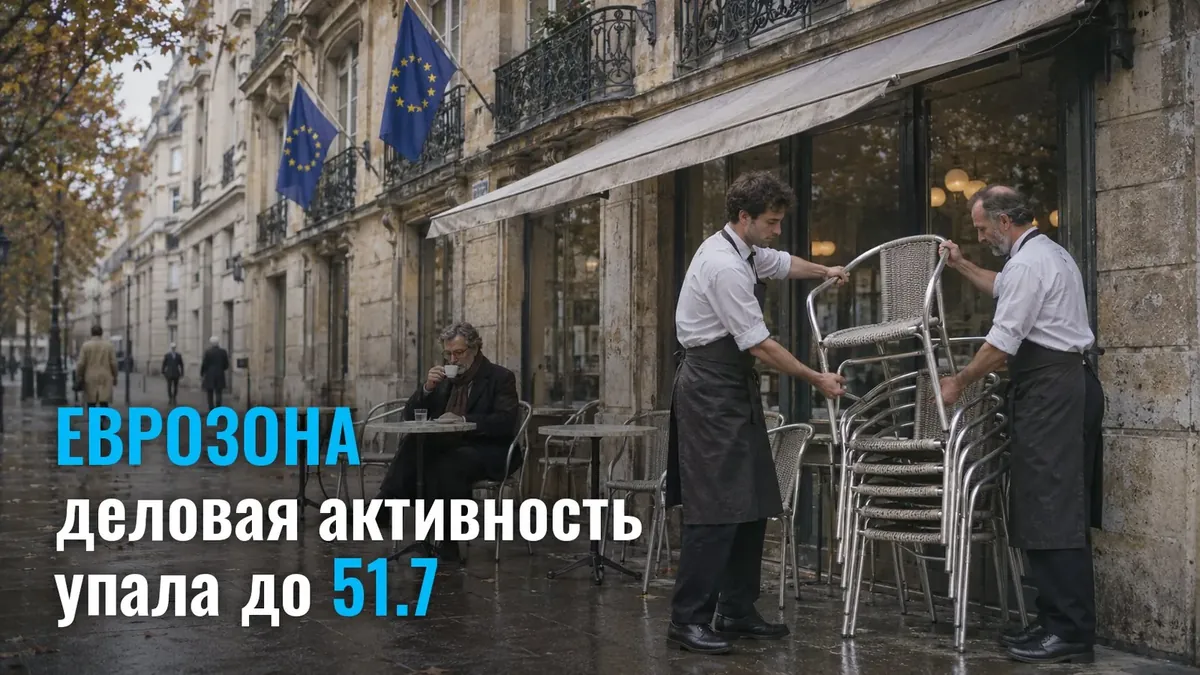
Eurozone reports slowdown in business activity in October. The composite index fell to 51.7 from 53.1 in September. The final data was published on November 4 at around 12:01 Moscow time.
What PMI is. It is a survey of purchasing managers about how things are going in their companies. It shows the direction of the economy earlier than official statistics.
Why this matters to a trader. Such figures move the euro and European indices during the European session.
What exactly came out?
- Composite PMI - 51.7, previously 53.1. This is the composite index for manufacturing and services.
- Services PMI - 51.4, previously 53. This is the index for the services sector.
A value above 50 means that business is generally increasing activity, below 50 means it is contracting. The closer to 50, the weaker the growth.
Why did the index fall?
The main contribution came from the services sector. In the eurozone economy it carries the most weight. Its decline of 1.6 points over the month dragged the composite index down.
- Both indicators are still above 50. The bloc's economy is growing.
- The pace of growth is noticeably weaker than in September.
What does this mean for a trader?
PMI comes out earlier than official data on GDP and inflation. The market reads it as a leading signal on the state of the economy.
- Betting on a soft ECB. Weakening business activity is an argument for those expecting policy easing.
- Where it plays out. Primarily in EUR/USD, EUR/GBP and European indices.
- Volatility window. First data comes out for France and Germany, then the composite figures for the bloc. Each release can move the pair.
Key point: the eurozone PMI block is a standard window of heightened volatility in the European session. It is convenient to keep release dates in the economic calendar.
What's next for the euro?
The nearest reference point is inflation and the ECB. The market is waiting for the next batch of price statistics and the regulator's meeting.
- Watch the news window. If you trade such releases, it is worth choosing a challenge to suit your style.
Do you trade the euro in the European session?
The eurozone PMI block comes in a tight sequence: France, Germany, then the composite figures for the bloc - and the EUR/USD spread swings wildly during those minutes. If that is how you work, the account rules matter more than the chart markup: some prop firms explicitly prohibit holding a position at the moment eurozone statistics are released, while others simply cut leverage during that window. Selection filters show such clauses for a specific pair in a minute.