

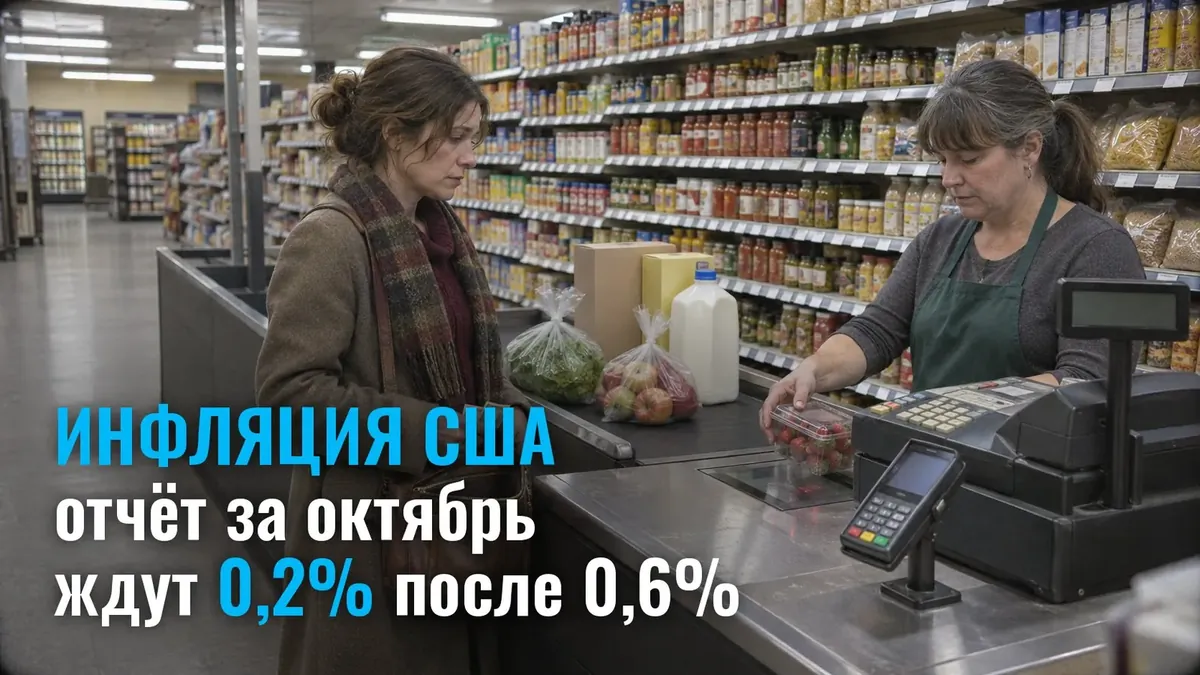
On Tuesday, November 10, at 16:30 MSK, the US publishes the consumer price report for October. The FactSet consensus is plus 0.2% for the month. In September, growth was 0.6%, and annual inflation accelerated to 3.7%, the highest since May.
The consumer price report shows how much goods and services for the population rose in price over the month. It is used to judge where inflation is heading.
For a trader, this is the main point of the week. At 16:30 the figure is released, and ranges on major assets widen within a minute.
Which figures decide?
- 0.2% versus 0.6% - the forecast for October and the September actual for monthly inflation.
- 0.3% and 2.6% - core inflation in September for the month and for the year. This is price growth excluding food and fuel, and it is used to judge sustained price growth.
Key point: the market is driven not by the size of inflation, but by the deviation of the actual from the forecast. A difference of tenths of a percent is enough to send candles surging at 16:30.
Why is the backdrop alarming?
Producer prices are rising faster than consumer prices. These are prices at the factory gate; they reach stores later.
- 1.3% for the month - US PPI growth in September.
- 6.3% for the year - the strongest annual growth in more than three years.
- November 13, 16:30 MSK - fresh PPI is released.
What else is on the week?
- November 10, 23:30 and 02:30 MSK. Michelle Bowman, Vice Chair for Supervision of the Fed, speaks on the state of the economy.
- November 11, Veterans Day. The bond market is closed on the recommendation of SIFMA, equities trade. Liquidity is thinner than usual.
- November 12, 10:00 MSK. UK GDP for the third quarter, previous value 0.5% versus the previous quarter.
- November 12, 16:30 MSK. Jobless claims, last time 189K.
- November 13, 13:00 MSK. Eurozone GDP, preliminary 0.4% for the quarter and 1.3% for the year.
- November 15. Japan GDP.
All release dates and times are collected in the economic calendar.
What will happen on Tuesday?
Crypto enters this week weakened. The four major coins are trading in the red.
- BTC $74,238 (-2.07%)
- ETH $2,107 (-5.66%)
- XRP $1.09 (-6.04%)
- SOL $86.37 (-3.08%)
Two volatility scenarios, without a direction forecast.
- Scenario A. Actual around 0.2% - the impulse is short, the market quickly switches to Bowman and PPI.
- Scenario B. A deviation from consensus - a sharp widening of ranges on DXY, gold and crypto, with a move into thin liquidity on November 11.
Trading conditions on news differ for each program; they can be compared in the prop firm catalog.
Planning to trade Tuesday 16:30?
The week is made up of four moments when a figure is released and the range within a minute becomes wider than the daily one: inflation, Bowman, claims, PPI. Prop programs treat such trading differently: some allow holding a position through a data release, others close the account for a single trade in the window around the release. For others, allowable slippage widens, and drawdown is calculated differently. These points are read in the rules in advance, not after the account is disabled. There is still time before Tuesday.